The August 9, 2023 Hawaii Wildfires
- Briefing Note 490
Tahiry Rabehaja & James O’Brien from Risk Frontiers
On August 9, 2023, around 11 fires burned across the Hawaiian islands, one of which tore through the township of Lahaina on the island of Maui. This particularly fast-spreading fire engulfed most of the buildings, razing timber houses and historical monuments. At the time of writing this article, these fires have collectively claimed 115 lives, ranking them as the deadliest fires that have occurred in the US over the past century. The property and infrastructure damages caused by these fires are extensive and the cost of rebuilding Maui is currently estimated to be in the excess of USD 5.5B.
How did the Maui fire start and evolve?
The fires ignited when Maui was facing dry weather and powerful winds. From August 7 to 9, 2023, the island encountered maximum gusts ranging between 72 to 107 km/h, as reported by the National Weather Service. A high-pressure region north of the island and the passing of Hurricane Dora to the south contributed to the wind intensification. The US Drought Monitor (https://droughtmonitor.unl.edu/) indicated that the southwestern portion of the island was experiencing moderate to severe drought during the fires’ occurrence. Coupled with low humidity and high wind speed, ignitions within the dry fuel presented the perfect conditions for fire to spread quickly and behave in unexpected ways. This is a lesson we’ve recently experienced in Australia during the Black Summer fires of 2019.

The cause of the fires that occurred on Maui remains uncertain. One potential explanation is that the ignition source comes from the electrical network serving the town of Lahaina. Hawaiian Electric claims that this deadly fire was not ignited from their network. However, if found liable, they could then be responsible for the property damages and personal injuries, as in the case of the 2018 Camp Fire, when Pacific Gas and Electric Company had a liability in the excess of USD 30B, causing them to file for bankruptcy. What is evident, however, is that the strong winds from Hurricane Dora, situated just 800 km south of the island, played a significant role in transforming isolated fires into swiftly spreading blazes (with gusts over 70 km/h). As early as August 4, the US National Weather Service observed that the combination of Dora’s winds and drought conditions would result in hazardous fire-prone weather. By August 7, the agency issued a Red Flag Warning, indicating a high risk of fire danger for the downwind regions of all Hawaiian Islands.
The fire in Lahaina, located on the western edge of Maui, covered an area of approximately 9.3 km2. Tragically, the fire engulfed the whole town and left the surrounding vegetation relatively unscathed. As depicted in Figure 1, the fire ignited well within the town’s perimeter and spread through buildings, levelling them to the ground.
How often does Hawaii experience wildfires?
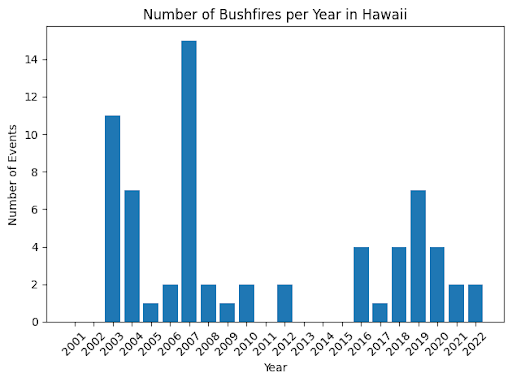
Wildfire occurrences are relatively common in the Hawaiian islands. Over the past two decades, for which we have detailed fire footprint data from the MODIS Burnt Area Product, the islands collectively experienced approximately three wildfires per year, although there is some annual variability. During the period from 2001 to 2022, the frequency of wildfires exhibits fluctuation, with some years witnessing more pronounced activity than others. For instance, the year 2007 marked a notably higher wildfire frequency with 15 incidents, while other years experienced fewer occurrences (Figure 2).
*These analyses were carried out as part of a collaboration between Macquarie University and Risk Frontiers to develop a wildfire loss model for the USA.
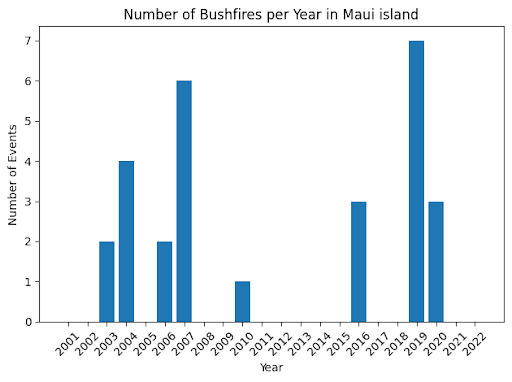
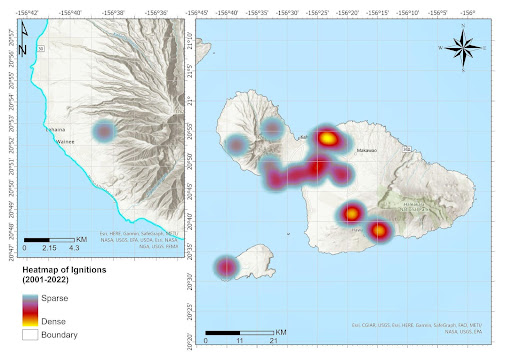
Maui has had its fair share of ignitions, recorded from 2001 to 2022. However, most of these fires covered unpopulated areas and thus the damages were limited. Figure 3 depicts the heatmap illustrating the occurrences of wildfires spanning the years 2001 to 2022. These occurrences are based on ignition points extracted from the MODIS Burnt Area Product, specifically focusing on the region of Maui, Hawaii. In 2023, Hawaii has recorded 11 events, six of which occurred on Maui, which means that this fire season is on the higher side in contrast to the past two decades, but not greatly outside of the historical data.
What were the main sources of ignitions?
Wildfires can originate from two primary sources: human activities and natural occurrences. Natural elements such as lightning and volcanic eruption can contribute to the ignition of wildfires. Human-induced factors often assume a significant role, including careless smoking, power equipment malfunctions or unattended campfires. Approximately 90% of wildfires in the United States are caused by human activities (Congressional Research Service, “Wildfire Statistics.” Accessed June 29, 2022). Hawaii is no different in that most wildfires start due to arson, faults, negligence and accidents such as fireworks, outdoor cooking accidents, vehicle-caused wildfires and agricultural practices.
The 2010 Hawaii Statewide Assessment of Forest Conditions and Resource Strategy states that:
Human error combined with the spread of non-native invasive fire-adapted grasses, shrubs, and trees, has led to an increase in wildfires across the islands. The leeward portions of the main Hawaiian Islands, which typically receive less rain than other parts of the islands, are particularly susceptible to wildfires and have experienced an increase in the number and severity of wildfires.
How big do fires grow in Hawaii?
The geography of the Hawaiian islands means they are relatively constrained in terms of physical expanse (the largest island is around 10,432 km2) but some fires do grow relatively large. Over the past two decades, the July 29, 2021 fire burnt through 170 km2 on the island of Hawaii (the “Big Island”) and lasted for ten days. The second-largest wildfire within the dataset occurred in 2018. This fire ignited on July 30, 2018 and was actively burning for ten days with a final footprint size of 70 km2. The following table shows the top ten largest Hawaiian wildfires between the years 2001 and 2022.
| Start date | Last date | MODIS Event duration | Size (km2) |
|---|---|---|---|
| 29/07/2021 | 7/08/2021 | 10 | 170 |
| 30/07/2018 | 8/08/2018 | 10 | 69.97 |
| 23/07/2005 | 7/08/2005 | 16 | 62.25 |
| 30/06/2007 | 10/07/2007 | 11 | 30.91 |
| 23/02/2020 | 29/02/2020 | 7 | 20.17 |
| 8/07/2019 | 15/07/2019 | 8 | 19.748 |
| 17/02/2016 | 21/02/2016 | 5 | 18.675 |
| 29/09/2019 | 5/10/2019 | 7 | 17.387 |
| 8/07/2020 | 15/07/2020 | 8 | 15.88 |
| 27/08/2009 | 2/09/2009 | 7 | 14.811 |
It is important to note that the size of a fire does not necessarily reflect the severity in terms of casualty and property damages. In fact, the deadly and destructive Lahaina fire is relatively small by comparison, at 9 km2. This clearly shows that risk requires some vulnerable exposure to intersect the hazard. For Lahaina, the fire hazard was located directly on top of the town and caused the devastation that was witnessed.
What was the impact of this wildfire on the islands?
Although wildfires are relatively common in Hawaii, historical records show that they are typically benign. However, this set of destructive fires in 2023 has changed that perception for Hawaii from this point forward.
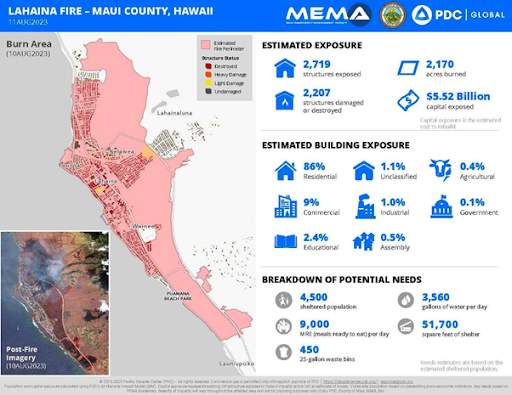
The Pacific Disaster Center (PDC) and the Federal Emergency Management Agency (FEMA) have jointly issued damage assessment maps encompassing several wildfires within Maui County. As of August 11, 2023, the Lahaina Fire’s impact, as reported by PDC, revealed significant damage assessment as per Figure 4. Approximately 2,719 structures were exposed to the fire, out of which 2,207 structures suffered varying degrees of damage or were entirely destroyed. Notably, the majority of structures exposed to the fire were categorised as residential buildings (86%).
The fires initially ignited within the vegetation interfacing the township of Lahaina and swiftly propagated into inhabited regions, propelled by wind gusts surpassing 70 km/h that fanned through the island. The blaze rapidly surged through the coastal town, traversing intersections and vaulting over historical wooden edifices within the town centre, which has its origins dating back to the 1700s and holds a distinguished position on the National Register of Historic Places.
The Hawaiian islands’ population is acquainted with natural disasters – in particular with hurricanes and tsunamis – but it is clear that they were caught by surprise. It is widely reported that Hawaii’s state-of-the-art warning systems failed to warn the islanders of the fires, where clear and timely warnings could have helped people evacuate safely had they known what to do. Moreover, the intensity at which the fire burnt through Lahaina and wind gusts fanned by Hurricane Dora impeded firefighting efforts. Given Hawaii’s familiarity with natural disasters and its level of preparedness, this tragedy is certainly unexpected but should not have been unforeseeable.
So what is next?
It will take years for Hawaii, and in particular Maui, to recover from this disaster. In the context of a warming planet under climate change, longer, warmer and drier fire seasons are expected to exacerbate wildfire frequency and severity globally. The various devastating fire seasons of the past few years and across the globe remain a stark reminder of the risks that wildfire poses on communities, economies and the environment. Moreover, the Intergovernmental Panel on Climate Change (IPCC) reported on the increased likelihood of compound events and continued increase with further warming. Although a coincidence might have played a role in the low-pressure system fanning the Hawaiian fires without bringing much precipitation, longer fire seasons will also indirectly increase the likelihood of such a coincidence.
In line with an increasing fire risk, it is important to keep an objective view of the potential impact of wildfires on our society, and thus re-enforcing the importance of continued investment in improved fire detection and response capabilities. In addition, risk analysis tools such as natural catastrophe models capable of assimilating future climate scenarios are particularly useful to stress test current response and mitigation capabilities with respect to a changing climate.
*FireAUS is Risk Frontiers’ Australian wildfire loss model which supports future climate scenarios analysis. A similar model, targeted for the mainland US, is currently being developed through a collaboration between Macquarie University and Risk Frontiers.
About the author/s

Tahiry is a Software Engineer with years of experience working with multiple operating systems, container technology, programming languages and various software stacks. Tahiry holds degrees in Mathematics and a PhD in Computer Science.

James is Risk Frontiers’ Chief Geospatial Scientist developing solutions and providing thought leadership for the integration of physical, social science and climate change factors in modelling risk, exposure, vulnerability and resilience for people, property and infrastructure using geographical information science.
