The October 2022 Victorian Floods
Jacob Evans, Jonathan Van Leeuwen, Stuart Browning
As of Tuesday the 18th of October 2022, the last few days has seen large parts of Victoria, Tasmania and New South Wales experience torrential rain and flooding.
In the early hours of Friday morning, several areas across Victoria experienced major flooding, and at this time, further flood peaks are likely to occur over the next two weeks.
Of significant note is the flooding that occurred in inner city Melbourne and northern Victoria. So far over 500 homes are reported to have been inundated in Victoria and around 100 in Tasmania, with the Victorian State Emergency Service (SES) issuing 169 Major Flood warnings from the 12-17th of October.
Modelling is currently indicating up to 7,500 homes could be inundated in northern Victoria and potentially close to about 34,000 homes in Victoria either inundated or isolated.
Climate Drivers
The weather system that brought flooding rains to Victoria was part of a progression of depressingly familiar storm types lining up across the continent over recent months. Cloud bands stretching from the Indian Ocean into southeast Australia have become all too regular (Figure 1a), along with saturated soils and devastating floods.
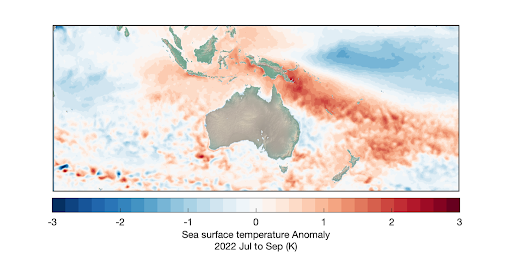
It is unusual to get so many heavy rain days; unless you take into consideration the background state of the Indo-Pacific climate system which is currently configured to increase the probability of these type of events. Under the current set-up, tropical oceans around Australia are warmer than usual (Figure 2), and warmer than other tropical ocean areas; the atmosphere responds to this with more convection and rain, especially over eastern Australia. Essentially an opposite configuration compared to spring 2019, prior to the severe bushfire season.
The influence of Australia’s main climate drivers was on display during Victoria’s recent flooding event when extreme rainfall occurred at the convergence of air masses from the northeast, northwest, and south.
To the northeast of Australia, the Central Pacific has just seen a 3rd consecutive La Niña event declared, the influence of which could last through until next autumn and deliver the eastern states another summer of above average rainfall. During summer, and more so during La Niña, tropical easterly winds extend further south, bringing warm-season rain from the northeast as far south as Sydney. This can increase the probability of extreme rainfall totals because most atmospheric moisture is concentrated in the tropical latitudes.
To the northwest of Australia, the tropical Indian Ocean has been unusually warm, and especially so when compared to the western Indian Ocean. The Indian Ocean Dipole (IOD), a measure of the temperature difference between the western and eastern tropical Indian Ocean, has been negative since June, during which time a progression of northwest cloud band style weather systems have delivered above average rainfall across southeast Australia, with some locations experiencing their wettest year on record.
Storms originating to the south of Australia, in colder latitudes, are often referred to as being cold-cored, as opposed to storms originating in the tropics which are conveniently called warm-cored. Some of our most severe storms, including east coast lows, intensify when these cold and warm weather systems collide.
In the days preceding Victoria’s floods, warm moist air from the Tasman Sea was being transported inland in a persistent northeast flow which is a typical situation for La Niña.
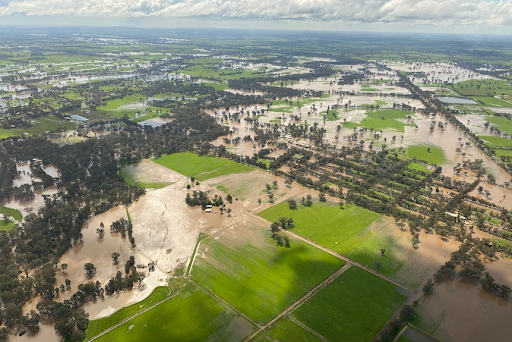
Concurrently a northwest cloud band type event developed off the coast of western Australia and began transporting relatively warm moist air across Australia, this was aided by a winter style cold-core extra-tropical storm moving in from the Southern Ocean. When these 3 air masses collided over Victoria the combined effect was over 200 mm of rain and devastating flooding (Figure 1b).


Victoria
On Tuesday the 12th of October the Bureau of Meteorology (the Bureau) issued a flood warning for several catchments in Victoria potentially starting Thursday.
Warnings continued to intensify throughout the week, and in the early hours of Friday morning inner city Melbourne, and several northern Victoria towns experienced major flooding.
In Melbourne, Maribyrnong was the worst impacted suburb with several homes and businesses inundated. The Maribyrnong River peaked at 4.18 m, slightly below the highest recorded level of 4.5 m from 1906. The severity of the event has led to Melbourne Water reviewing the Flemington racecourse flood wall after residents have blamed it in exacerbating the issue, as it has taken away 1.2 million m2 of floodplain which potentially forced water into new housing developments and industrial estates along the valley. Other impacted suburbs included Kensington, Ascot Vale and Keilor. The SES estimated about 100 properties were flooded.
In northern Victoria, towns along the Goulburn River also experienced flooding. In Seymour, flood levels have peaked above record levels recorded in May 1974. The Victorian SES stated that there was the potential for 187 properties to be inundated, and a further 279 properties that could be isolated. Flooding was further observed in towns along the Campaspe River such as Rochester which remains inundated, and where emergency services have warned worst-case river rises could result in a one-in-200-year flood event later this week.
Over the weekend the flood crisis worsened with several more towns being inundated in Northern Victoria. By Sunday approximately 6,000 properties were without power, residents in the towns of Charlton and Echuca were told to leave their homes immediately (where up to 400 properties could have been affected), and residents in Shepparton, Orrvale, Murchison and Mooroopna were told it was too late to leave their communities.
The Shepparton area along the Goulburn River was expected to have 7,300 homes and businesses affected, with 2,500 potentially being inundated. Major flood warnings were also in place for the Acheron, Avoca, Broken, Loddon, Murray and Yea rivers, and the Castle, Hughes, Mt Emu, Seven and Sunday creeks. Echuca, which is located downstream, could have up to 400 properties affected and is expected to be hit by two flood peaks, one on Tuesday and another later in the week. Meanwhile, along the Loddon River, residents of Kerang have been warned to evacuate, as Kerang could be isolated for two weeks.


Tasmania and NSW
Major flooding from this flood event also hit parts of Tasmania. Tasmania’s north-west and north have been impacted the most with floodwaters damaging 53 residential, 18 businesses and 21 community facilities yet.
A major flood warning is still in place for the Meander River at Strathbridge, and a moderate warning for the Macquarie River. A number of landslides resulting from torrential rain have damaged infrastructure, blocked roads and complicated escape routes. There is also concern regarding tidal activity in the Kanamaluka/Tamar Rivers.
On Friday the central western NSW town of Forbes experienced flooding, with 250 homes affected. Towns along the Victorian-NSW border such as Albury and Moama also have flood warnings. Meanwhile, heavy rainfall across Victoria is flowing into rivers in NSW, leading to potential major flood warnings for the Murray River, Lachlan River and the Murrumbidgee River. Due to the long distances covered by these rivers, flooding is predicted to occur later in the week. More heavy precipitations predicted towards the end of the week might further contribute to rising flood levels in these parts of NSW.
Recovery
The Australian Defence Force is assisting with evacuations, sandbagging and clean-up of flood impacted regions. The clean-up is expected to take months, with the lingering weather conditions delaying the process. The mixing of black water (sewage) with floodwaters, as reported in certain areas, further increases the complexity and cost of the clean-up.
With the event still unfolding and the potential to last weeks, it is too early to predict a total event loss. However, given the widespread scale of flooding it is estimated that up to 9,000 homes and businesses could be inundated. For reference, the NSW-Qld flooding in February and March has an insured loss of $5.45 billion reported by the ICA [ICA (2022)] which saw 234,000 insurance claims. For this event the media reported potentially 50,000 homes were inundated.

References
ICA (2022). “Catastrophe 221: NSW and South East Queensland Floods”. https://insurancecouncil.com.au/ 17/10/2022


