Twitter can predict hurricane damage as well as emergency agencies
By John Bohannon Mar. 11, 2016.
Following the community–initiated Facebook groups that emerged during the 2010/11 Queensland and Victorian floods, Risk Frontiers undertook research into the use of social media as a complementary form of hazard and risk communication. The online questionnaire underpinning the study concluded that it has value to the emergency services, not only as a tool to disseminate information but also as an important resource to tap into and review informal communications and resilience.
The power of social media and the value it has to emergency services was demonstrated again following Hurricane Sandy, and this Briefing Note discusses the research that showed that social media could be used to rapidly assess damage in the aftermath of an event.
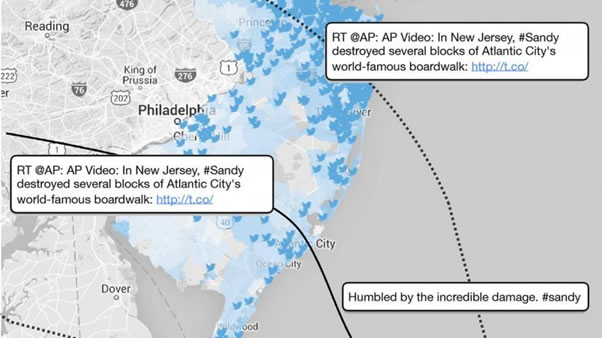
Mapping out the intensity of tweets during and just after a hurricane produced a map of damage on par with the government’s.
In October 2012, meteorologists noticed a massive low-pressure system forming over the waters south of Cuba. In just 5 days, it spun into one of the largest hurricanes on record, cutting a path up the eastern U.S. coast and devastating communities with flooding and 140-kilometer-per-hour winds. Superstorm Sandy posed a massive problem for government clean-up crews. Where should they send their limited emergency supplies and services? A new study suggests a way to get that answer fast: Just listen to Twitter.
Mapping damage is a crucial first step in hurricane response. Inaccurate mapping, as there was with Sandy and even more so with Hurricane Katrina in 2005, can add up to weeks—and in some cases months—before help arrives to those most in need. To predict where the worst damage has occurred, the U.S. Federal Emergency Management Agency (FEMA) puts together models that look at everything from geography to infrastructure to storm characteristics, and then flies over the affected areas to further refine their map. Surveying people on the ground in natural disaster zones is just too difficult.
A team led by Yury Kryvasheyeu, a computational physicist at Australia’s National Information and Communications Technology Research Centre of Excellence in Melbourne, wondered whether better data might already be waiting online. By 2012, people were relying on social media apps such as Twitter to communicate about real-time events. But can a map of tweets be translated to a map of damage?
Kryvasheyeu’s first task was to get the data. Though Twitter opened up its full archive to researchers back in 2014, many academics have been worried about the legal strings that might be attached to using the California-based company’s data. But the team only needed a subset for their experiment, so they bought it from one of the many third-party companies that collects, processes, and resells Twitter data. The database included all tweets in the world between 15 October and 12 November 2012. The team then narrowed the set to those with words like “hurricane,” “Sandy,” “frankenstorm,” and “flooding.”
Many tweets already had map coordinates locating their origin. But others did not. So the researchers also analyzed user accounts and message contents to further pin down the location of tweets. All in all, the team mapped out nearly 10 million tweets from more than 2 million user accounts.
The first discovery was reassuring. The relevant tweets weren’t just scattered randomly on the map: The closer people were to the hurricane, the more they had to say about it. But does such Twitter activity translate into actual damage? It was possible, for example, that local media coverage could amplify fear, even in areas that weren’t hit hard by the storm. So the researchers obtained data on the true extent of the damage from FEMA and the state governments of New Jersey and New York.
It turns out that Twitter was a remarkably good source of information on hurricane damage. The more damage Sandy actually did to a neighborhood, as measured by the per capita cost of the repairs, the higher the intensity of relevant tweeting from those areas just after the storm. In fact, Twitter was slightly better than FEMA’s own models in predicting the location and severity of damage, the team reports today in Science Advances. The main advantage of the technique is that it is a “virtually zero-cost solution,” says co-author Manuel Cebrian, a computer scientist at the Commonwealth Scientific and Industrial Research Organisation in Clayton, Australia.
Still, Twitter data have many limitations and pitfalls, says Urbano França, a computational public health researcher at Harvard Medical School in Boston. These include everything from “Twitter-bots” that robotically generate tweets to the quirks of who does and does not use social media. But, he says, the researchers in this case “seem to have thought of most, if not all, issues and potential loopholes.” The next step, he says, is to look for data on other social platforms, like Facebook, which has a much higher user base and “could potentially provide more precise results.” Then again, getting those data may prove even more difficult than dealing with Twitter’s data firehose.