The Mw 7.8 November 14, 2016 Kaikoura Earthquake: Briefing 5
This fifth briefing contains observations arising from a visit to Wellington and Blenheim (Dec. 5 – 12, 2016).
Briefing by Dr Kelvin Berryman (General Manager: Natural Hazards Strategic Relationships, GNS)
As shown in previous Risk Frontiers’ Briefing Notes, the NE quarter of the South Island is marked by a complex network of faults. Many of these, both onshore and offshore, were implicated in the November 14 event, but there were two main ruptures with these unzipping during a total event duration of ~90 – 120sec. The main energy release occurred some 120 km northeast of the epicentre, accompanied by surface fault displacements of ~5 – 13m with energy directivity towards the north. The earthquakes did not rupture the ground surface along the entirety of the faults.
The Kekerengu fault had a surface rupture of 70 km with about half of that occurring under the sea. It has ruptured three times previously in the past 1250 years and its current slip rate is comparable to that on the Alpine fault ~ 20 – 26 mm/y. It’s capable of a Mw 7.6 quake on its own. Its vertical movements raised the seabed, pushed the Cape Campbell Lighthouse 2 m northward, diverted streams and caused landslides. The former high-tide mark at Kaikoura is now 6 m lower than its pre-earthquake mark. Further north the Hope and Awatere faults moved but didn’t rupture the ground surface. A formerly unknown fault called the Papatea fault caused land movements and damage near Clarence.
The earlier GNS maps showing increased probability of earthquakes confined to the South Island assume a traditional exponential aftershock sequence. This ignores the bigger question raised by Paul Somerville (Risk Frontiers) about stress transfer to the Hikurangi Subduction Zone (HSZ) and the degree to which this transfer might increase the likelihood of a larger subduction zone earthquake. The HSZ underlies Wellington at a depth of 23 km.
Kelvin agrees that there would have been stress transfer but argues that this has happened often enough in the past with the HSZ remaining firmly locked underneath Wellington for some 500 years. In truth no one knows the answer to this question.
GNS consider a large HSZ earthquake as a tsunamigenic event capable of killing large numbers of people in and around Wellington. In their view a rupture on the Wellington fault is capable of generating the largest Probable Maximum Loss for the city.
Briefing by David Brunsdon (Director, Kestrel Group) and damage observations Wellington Dec 7 and 8
At the time of the visit about 40 buildings, most of which were formerly occupied by Government departments, had been evacuated. Most but not all of these are located on reclaimed land near the Port and Quays (Figure 1). These evacuations were thought to be mostly precautionary and awaiting more detailed engineering reports or because of non-structural damage such as the failure of roof panels, plumbing and electrical services. As a result about 10% of Wellington’s public servants are currently working offsite. Three buildings – 61 Molesworth Street, Statistics House and the Reading Cinema car park – are badly damaged.
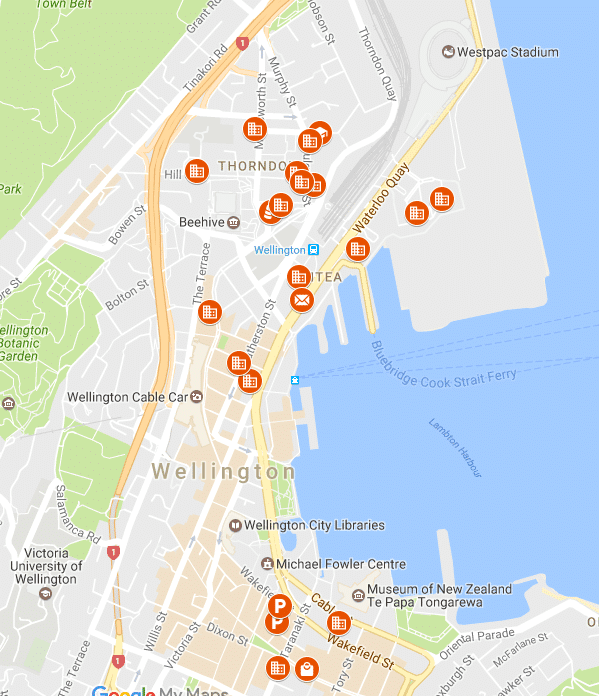
Figure 1: Locations of buildings with or suspected of experiencing damage. (http://www.stuff.co.nz/national/nz-earthquake/86510017/questions-asked-in-capital-but-engineers-say-no-such-thing-as-earthquakeproof).
Some of the non-structural damage was significant enough to have caused injuries if the quake had occurred during work hours, with glass shards embedded in plaster. It seems that interior fit outs are not designed to the same stringent engineering design specifications as is external glass which generally seemed to perform well. This might need more consideration in the Building code.
The 40 buildings damaged or suspected of having had damage to some degree is a lower bound estimate because in the absence of a declared state of emergency, there was no obligation on landlords to have buildings inspected or to report damage if found. The Wellington City Council has now introduced emergency legislation requiring owners of commercial properties to do so.
The Council is adopting a business-as-usual approach in the sense of not shutting down large parts of the city unnecessarily. This is a lesson learnt from the experience in Christchurch.
The vulnerability of buildings of a certain size (10 – 15 stories) has been discussed in Risk Frontiers Briefing Note 333. It appears that the damage to buildings in this height range is attributable to construction details. In particular, weaknesses have been identified in concrete frame buildings constructed in the 1980s and 90s that pushed engineering boundaries with pre-cast floors not tied into the flexible columns. These did not perform well under the high seismic loads of November 14. The former Statistics House building down near the Port is one such example.
Some brief notes on particular buildings follow.
Statistics House (Figure 2) — vulnerability to ground shaking had already been recognised and the top story already retrofitted. In the November 14 event, two lower floors partially collapsed together with a lot of non-structural damage. In Figure 3 collapsed floor planking is visible. Four other buildings owned by CentrePort also suffered damage including Customhouse, Shed 39, the BNZ building that had suffered severe non-structural damage in the Seddon earthquake in 2013, and Shed 35, an unreinforced masonry heritage building.
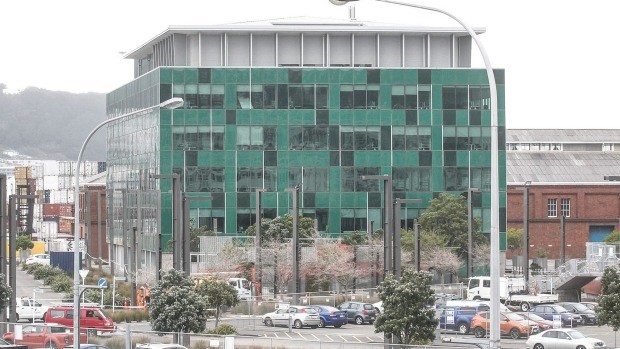
Figure 2: Statistics House – the major structural damage is to the lower left hand corner of the building, and there is nonstructural damage on other floors. (http://www.stuff.co.nz/national/nz-earthquake/86510017/questions-asked-in-capital-but-engineers-say-no-such-thing-as-earthquakeproof). Shed 39 is the masonry building to the left and behind Statistics House.
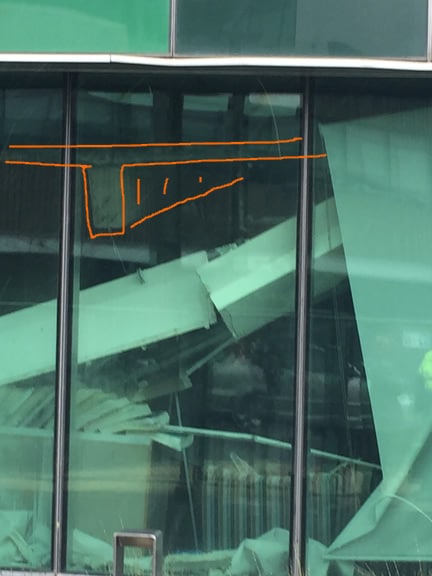
Figure 3: Failure of pre-cast floor element in Statistics House, and a lot of non-structural debris.
Reading Cinema Car Park: Most of Tory Street and access to the adjacent cinema and most shops in Tory Street and some in Courtney Place is blocked off pending a decision about the future of the car park, which was deemed likely to fail in an aftershock. The car park is about 20 years old, of long span design and was damaged in the 2013 Mw 6.5 Seddon earthquake. Owners of vehicles have not been allowed entry to bring out their cars.
61 Molesworth Street: This formerly ‘vacant’ multi-story building (Figure 4) is being demolished already. A column on level 4 sheared and left the curtain wall vulnerable. It’s believed that the owner of the building, Primeproperty, made a commercial decision to take the insurance payout and to demolish presumably with the intention of rebuilding something higher and better. Tenants who were living illegally in the building have not been allowed to retrieve personal belongings because of the risk of failure.
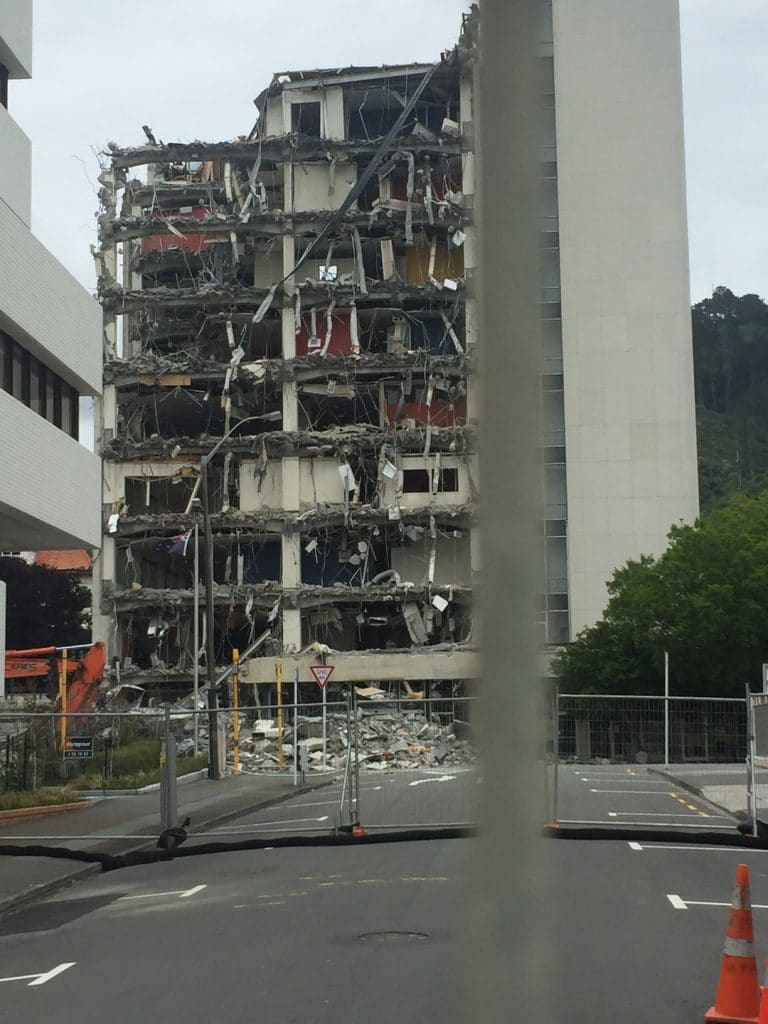
Figure 4: 61 Molesworth Street in the process of being demolished.
Queensgate Mall (Lower Hutt): The car park and cinema complex above the car park were already in the process of being demolished. Some of the Mall remains open for business. The Mall had been refurbished in 2006.
Asteron Centre 1 Featherston Street opposite railway station and bus terminus. This near new premium grade 17-story building possesses the largest office floor area in Wellington (48,000 m2). The issue seems to be with the stairs and tenants are again taking a precautionary approach. It was not clear if the stairwell is structurally important.
The Port. The land around the damaged buildings experienced liquefaction and some settlement or uplift. The reclaimed land is likely a smorgasbord of soil conditions. The port seemed to be operating normally as far as we were able to judge with logs still being delivered and ferries berthing. From the Oriental Bay side of the harbour, many of the stacks of containers (up to 6 containers high) appeared higgledy-piggledy.
Good News Stories:
Along the quays are a number of unreinforced masonry buildings that have been retrofitted and which performed well. These short stiff buildings may not have been tested to the extent of taller buildings because of the character of the seismic demand (Risk Frontiers Briefing Note 333). In the Woolstore Design Centre in Thorndon Quay, a century-old 3-story unreinforced masonry building located not far from the damaged buildings in the Port area, and where a lot of steel retrofitting has been done, shops selling high end ceramics and glassware didn’t even have product falling off shelves. Again how much of this can be put down to the local seismic demand and how much to the retrofitting is hard to know. It is likely that much of this retrofitting was encouraged by the Wellington City Council’s subsidies for retrofitting and remission of rates during such works and once a building is taken off the Earthquake-prone Buildings List.
A curious news story with implications for seismic design:
The original BNZ Centre at 1 Willis Street, Wellington, was designed with a ductile steel frame with construction commencing in 1974. When completed in 1984, it was NZ’s tallest building at 103 m. Its construction was held up for around nine years as a result of a political standoff between the Muldoon government and the Boilermakers Union, who claimed exclusive rights to weld structural steel. Ongoing strikes and go-slows eventually led to the union’s deregistration but this experience discouraged steel construction in New Zealand for many years. However, most of the reconstruction of Christchurch’s CBD is being done in steel.
Visit to a Blenheim Winery
I was fortunate to gain access to a winery, as many of the big-name enterprises were remaining coy about their experience. The main forms of damage were not to buildings themselves but to stainless steel fermentation vats and I understand this to be common across the region.
Overall the damage in this winery was not overwhelming in part because of lessons learnt in the 2013 Seddon earthquake and the investment in stainless steel tie-downs (Figure 5).
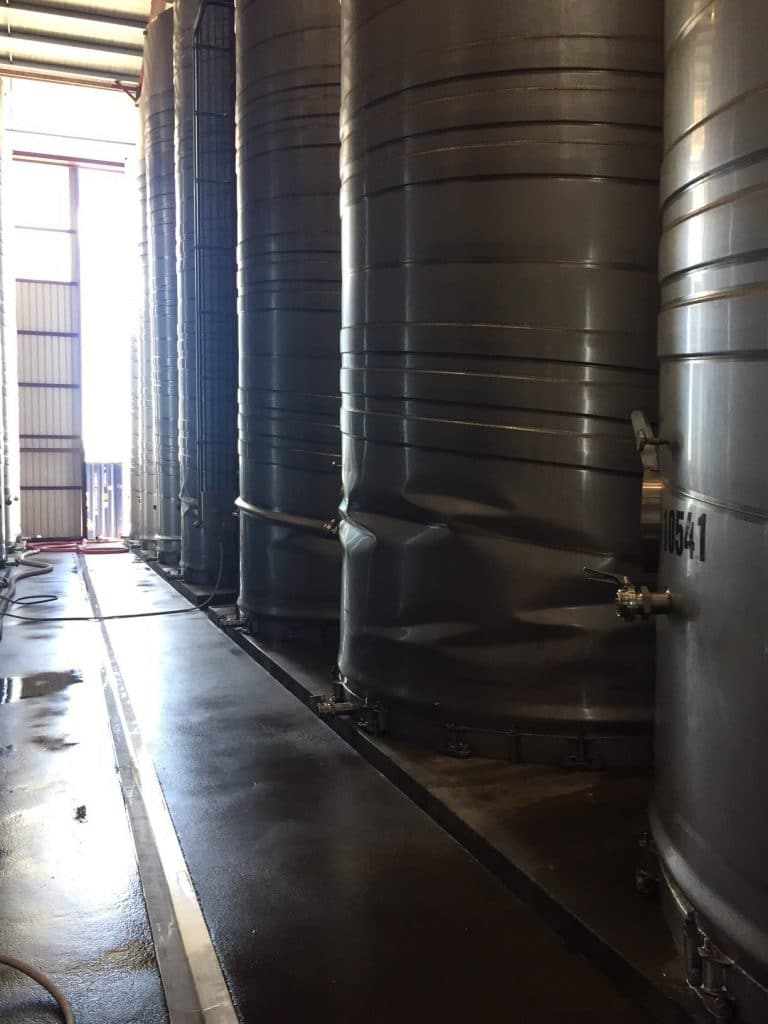
Figure 5: ‘Elephant foot’ bulging in the walls of the fermentation vats. The stainless steel tie-downs are just visible and are spaced at roughly 50 to 75cm around the perimeter at the base of the vat on the concrete pad.
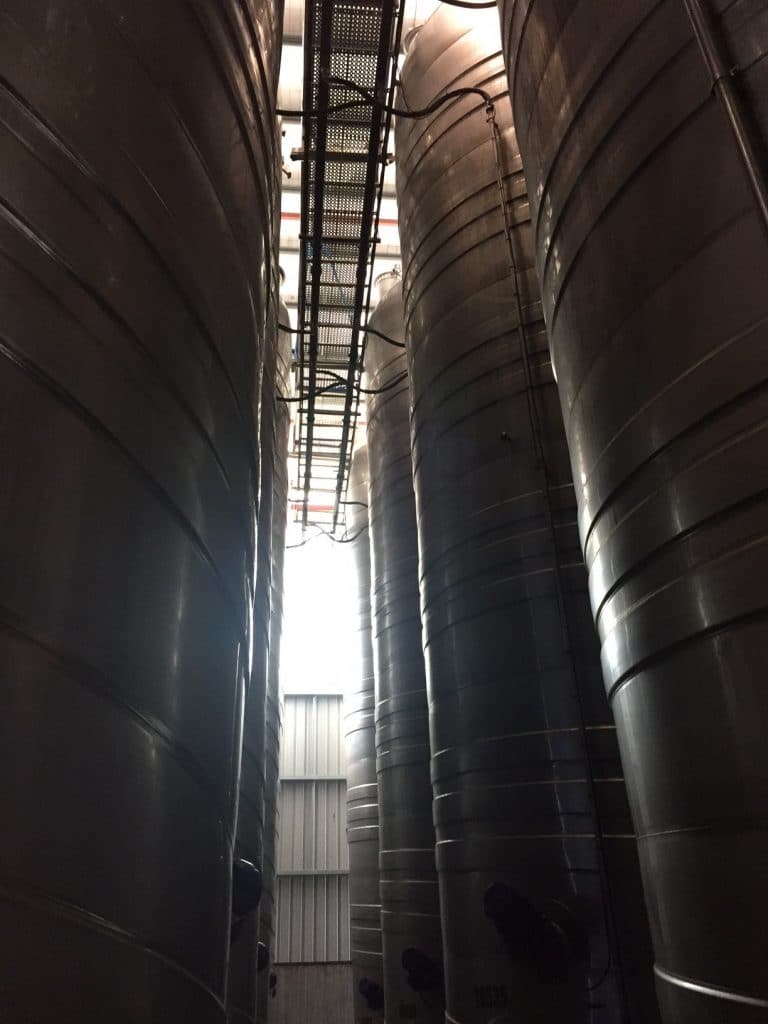
Figure 6: A tank learning against the catwalk.
The forms of damage have been seen before: first there was some distortion to the tops of vats where these either banged against each other or against the elevated cat walks that allow winemakers access the top of these vats (Figure 6). It was incredibly lucky that the earthquake occurred at night when no one was in the winery.
Secondly there was some limited damage to the glycol cooling channels on a few vats but the most common category was the ‘elephant foot’ at the base of the vats that occurs when ~150 tonnes of must (the fermenting grape juice) after being lifted by vertical ground accelerations comes smashing back down (Figure 5).
The ‘elephant foot’ bulges are reparable by welding in a skirt on the inside. This work was already underway with tank fitters coming from Timaru.
The winery had lost about 5% of its production but last year’s vintage was a large one and this loss of wine can likely be tolerated. The biggest concern for the industry is whether there will be sufficient vat storage for next year’s vintage and time to repair those that need it.
Acknowledgements
This briefing note would not have been possible without the help of Pat Helm, Robyn Martin, John Hedges, Drs Kelvin Berryman and Mike Trought, Prof. Jason Ingrim, Dave Brunsden and Ben Miliauskas.