Seismic Risk Evaluation of Transportation Networks in Australia
- Briefing Note 489
Australia’s transportation networks provide the crucial linkages that enable the movement of goods and people across vast distances. While the continent does not have a high seismic hazard level, large earthquakes can nevertheless occur and cause significant damage because of the low ground motion levels used in the design of structures. Specifically, (Li et al. 2014, 2016) show that consideration of lifetime corrosion and differential ground motions at the different supports of bridges indicate potentially significant increases in the seismic fragility of bridges. The shocking collapses of bridge networks in San Francisco and Los Angeles in 1989 and 1994, described further below, further motivate the careful examination of the potential vulnerabilities in these networks in Australia.
By evaluating the seismic vulnerability of transportation networks, we can identify areas that require immediate attention and devise strategies to mitigate the risks. This briefing highlights the importance and advantages of conducting a comprehensive seismic risk assessment of Australia’s transportation infrastructure. Also, developing such a seismic risk assessment model can pave the way for assessing other perils, such as floods, and the risk assessment of other networks, such as the city’s water network, under similar hazards.
Australia’s sprawling transportation system faces several vulnerabilities that need careful evaluation, especially in the context of seismic risks. Many parts of the network are aging and may not have been designed with modern seismic considerations in mind, making them susceptible to damage during an earthquake (Li et al. 2014, 2016). Some areas may have a concentration of vital links, such as major intersections or hubs, that, if affected, could lead to widespread disruption in the transportation flow. Moreover, the vast geographical distribution of the Australian continent means that some regions might be more prone to seismic risks, and the infrastructure there might require special consideration. This diversity in landscape and age of the transportation infrastructure makes the evaluation of seismic risks a complex yet vital aspect of maintaining the system’s overall stability and functionality.
Given Australia’s transportation network vulnerabilities and the existence of seismic hazards, the need for a thorough seismic risk assessment is evident. For this purpose, the framework suggested by the Pacific Earthquake Engineering Research centre (PEER) provides an appropriate tool (Moehle and Deierlein 2004). This framework not only enables a comprehensive understanding of the elements contributing to the seismic risk but also permits the consideration of a wide range of uncertainties, ranging from structural capacity, seismic loading, response, and consequence uncertainties.
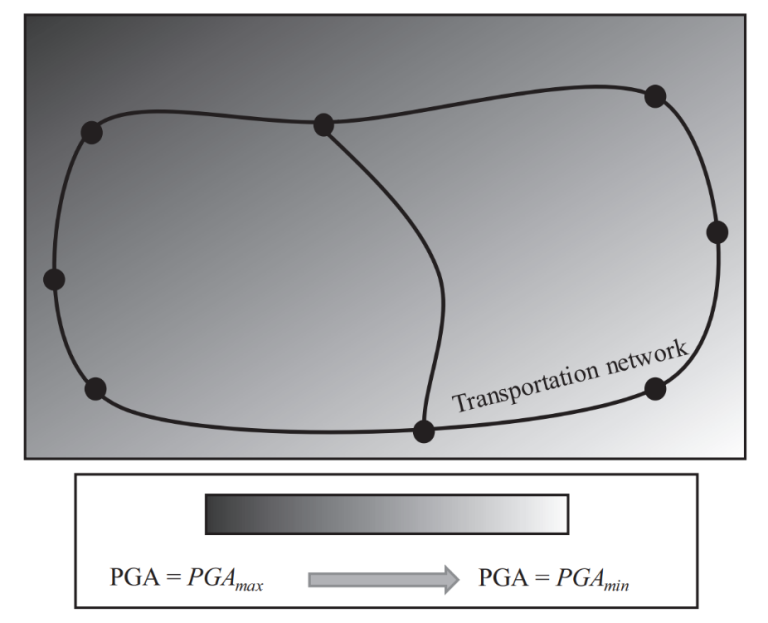
Following the PEER framework, the seismic risk assessment of a transportation network needs to encompass several critical facets. Firstly, there needs to be an assessment of the potential seismic hazards. This evaluation requires taking into account various factors that influence the seismicity of a region, such as the local geology, the presence of faults and the historical record of earthquakes. A representation of a seismic hazard map with a transportation network within it is schematically illustrated in Figure 1.
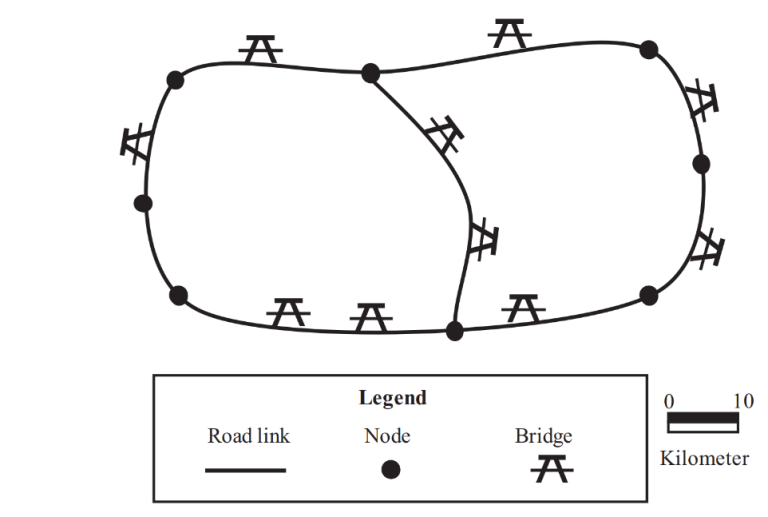
Following the seismic hazard analysis, the hazard exposure to each element of the transportation network can be identified by overlaying the seismic map and the transportation map. A schematic representation of a transportation network map is shown in Figure 2. By combining the identified hazards and the seismic response of each element of the network, the vulnerability of that element could be assessed. For transportation networks, this process is usually initiated by examining the bridges, as they may prove to be particularly susceptible to such events. In this process, bridges, based on their structural properties, are usually grouped and subjected to nonlinear time history analysis to develop fragility models.
Thirdly, the post-hazard traffic conditions of the transportation network are evaluated based on the identified seismic hazard intensities and probabilistic damage scenarios. The aim is to estimate the disruption to the transportation networks and identify methods for minimising them. Factors considered in this stage include reduced post-hazard traffic capacity and speed limits resulting from damage scenarios. Also, understanding drivers’ post-disaster behaviour, including route and destination changes, is critical. After performing traffic analysis, the post-hazard traffic conditions (such as travel time, distance, and speed) are computed, which allows for the seismic performance assessment of the transportation network.
Finally, the seismic performance of the transportation network is assessed through metrics including risk, sustainability, and resilience. Risk incorporates the likelihood of an event and the resultant consequences. Sustainability considers social, environmental, and economic metrics. At the same time, resilience examines the ability of a network to recover in a way that minimises social disruptions. All these consequences can also be extended to account for the impact of various hazard scenarios on different communities and the possible accessibility disruptions of isolated or remote areas to essential services (Taylor 2017). Together, these performance indicators provide a holistic understanding of the seismic performance of transportation networks and can help decision-makers to make more educated decisions in both the design and the management of such networks.
Bridge Collapses in Recent Earthquakes in California
Despite the general expectation that bridges in California were being designed to withstand earthquakes, the Mw 6.9 Loma Prieta earthquake of 17 October 1989, which occurred about 100 km south of the San Francisco Bay Area, caused widespread bridge collapses, including the San Francisco Bay Bridge linking San Francisco with the cities of eastern San Francisco Bay such as Berkeley and Oakland, as well as major freeway viaducts in both and Francisco and Oakland. Chapter 6 of Earthquake Engineering Research Institute (Lee 1990) describes damage to 13 bridges. The shocking disruption of the transportation network led to a board of inquiry chaired by Caltech Professor George Housner, who devised the response spectrum that is now universally used as a method of representing seismic demands on structures. The report of this board to the Governor of California (Housner and Thiel 1990) runs to 264 pages and led to a massive bridge seismic retrofit program throughout California. However, this program did not come in time for the 17 January Mw 6.7 Northridge earthquake in Los Angeles. Professor Housner once again chaired a seismic advisory board (Housner and Thiel 1994), this one to the California Department of Transportation (Caltrans), with the plaintive title “The Continuing Challenge” and containing Section 4 bluntly titled “Why did highway bridges collapse in the Northridge Earthquake.” Phase 1 of the retrofit program repaired 1,039 bridges in the San Francisco Bay area at a cost of $US1.08 billion; Phase 2 of the retrofit program repaired 1,155 bridges in the Los Angeles area at a cost of $US1.35 billion, and 9 state-owned toll bridges in the San Francisco Bay Area, Los Angeles and San Diego were retrofitted at a cost of about $US9 billion, for a total cost of about $US 11 billion (Caltrans 2019).
Case Study: San Francisco Bay Area
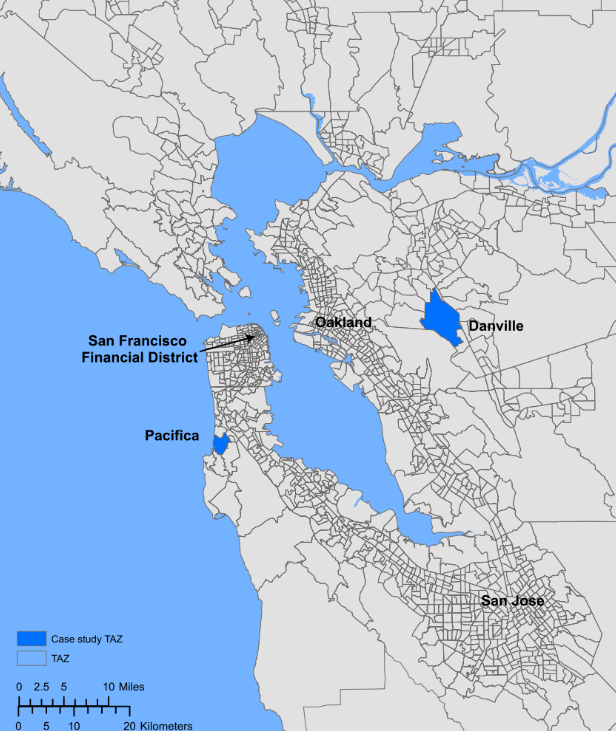
A research case study conducted by Mahalia Miller and Jack W. Baker at Stanford University (Miller and Baker 2016) is motivated by this recent history. In this study, the travel zones of the San Francisco Bay Area, Figure 3, are analysed for their post-earthquake accessibility (Miller and Baker 2016). In this study, the authors considered the effect of the region’s seismically active nature on its complex polycentric metropolitan transportation network. The consideration of the impact of the seismic actions over the diverse trip patterns of the region and varying routes and travel times led to the recognition of disparities in the region’s post-earthquake travel-related risks. The complex web of roads and transit networks is modelled using directed graphs, representing intersections and road links with specific vertices and edges. Their model includes 43 different transit networks such as buses, light rail, and ferries, as well as 1743 highway bridges and 1409 structures whose failure could affect the Bay Area Rapid Transit (BART) rail network. The study also accounts for non-physical centroidal links, representing flows from outside or minor local roads (Miller and Baker 2016).
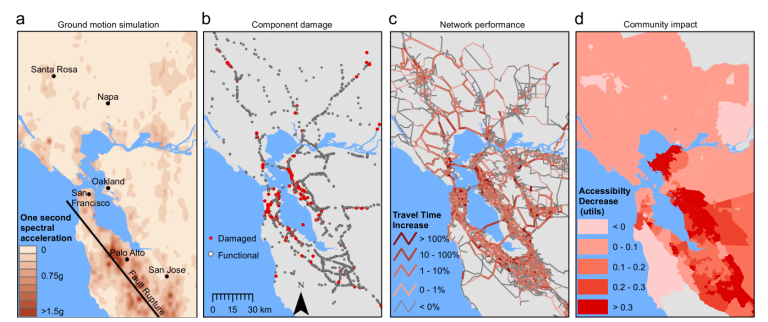
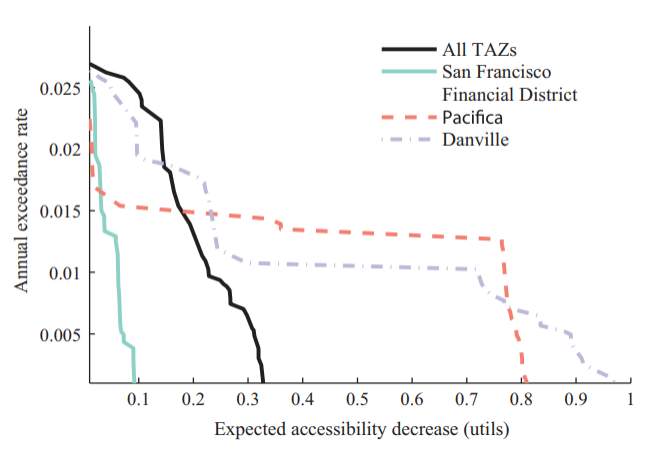
The analysis of seismic risk in the San Francisco Bay Area is divided into four parts. Figure 4a presents a detailed hazard map for a single simulation-based ground motion scenario, using varying colour shades to indicate the ground motion level. This map is based on historical earthquake data and geological models to predict the ground motion at various locations, showing areas of higher and lower hazard. In Figure 4b, the bridges that have suffered damage are marked in red, a result achieved through the application of structure-specific fragility functions. These functions are complex mathematical expressions that take into account the design, age, materials, and condition of the bridges, and they describe the likelihood of these structures reaching certain damage states under varying levels of seismic stress. Figure 4c illustrates the increase in travel time across the transportation network. The results are derived from simulations of the traffic flow and rerouting due to the bridge damage. Finally, Figure 4d visually conveys the extent to which various communities in different travel zones have been affected by the scenario, potentially providing insights into the socio-economic consequences and the decreased accessibility to essential services in the impacted zones. By aggregating the probability of accessibility loss for each region, the effect of the decreased annual exceedance rate is estimated, as illustrated in Figure 5. Together, these images paint a multi-faceted and highly informative picture of the potential impacts of seismic activity on the transportation networks and the communities within the region (Miller and Baker 2016).
Transportation Network Analysis of the Sydney Metropolitan Area
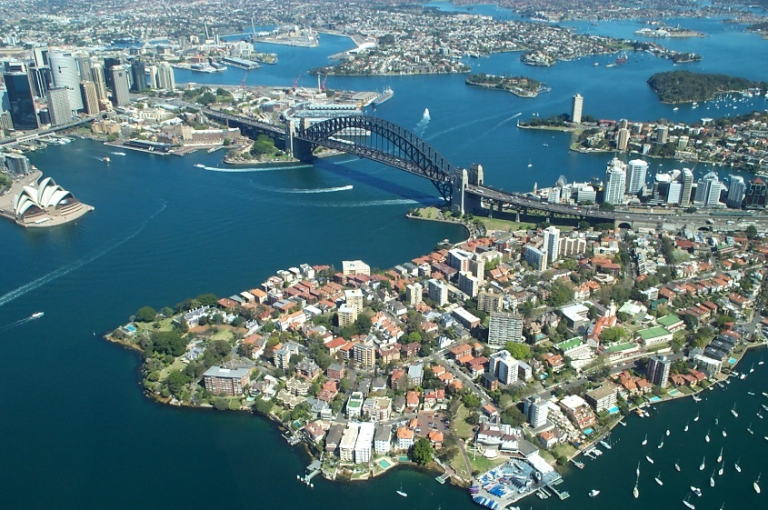
Among Australia’s cities, Sydney is one of the most suitable candidates for performing seismic risk analysis. By analogy with the San Francisco case study results and considering Sydney’s reliance on various bridges for connecting different locations, the need to analyse this city’s transportation network for seismic hazards is evident. Sydney’s network of bridges, critical to the movement of people and goods across the city, could be evaluated using reliable engineering methods to understand its potential seismic vulnerabilities and risks. Such an analysis is expected to yield insightful outcomes, providing a detailed understanding of how the city’s transportation network might respond to earthquakes and providing guidance on options for suitable mitigation strategies. This approach ensures that the transportation network remains resilient and functional, even in the face of unexpected seismic events, thus safeguarding the connectivity and accessibility that are vital to Sydney’s urban landscape.
Developing a Risk Mitigation Strategy
A comprehensive seismic risk assessment for Australia’s transportation networks would lay the foundation for a risk mitigation strategy that covers several vital areas. Firstly, strengthening and retrofitting would be needed to fortify existing infrastructure to withstand potential seismic forces. This may involve retrofitting older structures with modern materials and engineering techniques to align with current seismic standards. Secondly, strategic planning would involve redirecting investments into the transportation network to ensure alignment with seismic risk profiles, focusing on areas identified as particularly vulnerable. Such targeted investments could guide the development and enhancement of infrastructure in a manner that accounts for the unique seismic risks of different regions. Lastly, emergency preparedness would entail developing and implementing emergency response plans that consider potential seismic disruptions to transportation networks. This would include preparing clear protocols, resources, and communication strategies in order to enable a rapid and effective response and minimise the social and economic impacts of such adverse disasters. In this way, these measures could help in both safeguarding the functionality of vital networks and the well-being of the communities they serve.
Expanding the Method by Inclusion of Other Perils
Performing the seismic risk analysis for a transportation network provides the means required to expand the methodology to investigate the effects of other perils on the same network. For instance, based on sound engineering judgment and recent observations, floods contribute significantly to transportation disruptions in many cities in Australia. Thus, it would be worthwhile and relatively straightforward to analyse a transportation network for its flood risks after developing a model for quantifying its seismic hazard risks and consequences.
Moreover, in addition to other perils, the model of the network can be analysed under multi-hazard risk scenarios. These scenarios consider the simultaneous occurrence of two or more natural perils, such as an earthquake and a flood, and estimate the associated risk of such concurrent events. In this manner, by utilising advanced simulation techniques and state-of-the-art computational tools, various scenarios can be simulated to gauge the potential impacts of such concurrent events on the modelled transportation networks.
By considering various perils or the concurrent occurrence of two or more hazards, a comprehensive understanding of the effect of a natural hazard on transportation networks can be achieved. This multifaceted approach ensures that risk mitigation measures are integral to transportation planning, fostering resilience at both the design and implementation stages. It also provides decision-makers with accurate and actionable insights for building a resilient and secure system prepared to face the challenges posed by diverse natural hazards.
Risk Assessment of Other Networks of a City
Analysing the transportation network for a single natural hazard paves the way for analysing other essential networks of a city for seismic hazards. Beyond their transportation systems, cities are reliant on a complex web of interconnected lifelines, such as utilities, communications, emergency services, and public health systems. Evaluating these networks for seismic and other perils like floods, storms, or fires provides an in-depth understanding of their vulnerabilities and interdependencies (Taylor 2017). This multidimensional approach ensures that potential cascading effects of various hazards can be foreseen and mitigated, bolstering urban resilience, ensuring the continuity of essential services, and ultimately protecting the well-being and prosperity of the communities they serve.
Summary
As Australia continues to grow and evolve, so must its approach to understanding and mitigating the seismic risks to its transportation network. This necessitates rigorous analysis, data-driven decision-making, and the integration of advanced engineering solutions to enhance infrastructure resilience and ensure its long-term functionality and safety. Collaborative efforts involving government, academia, industry, and communities are needed to carry out this critical work. Today, by investing in a comprehensive risk assessment, Australia can anticipate and prepare for tomorrow’s challenges, reinforcing the critical arteries that support the nation’s life and growth. Furthermore, developing the seismic risk model of transportation networks paves the way for performing a comprehensive analysis of different networks and city lifelines for seismic and other perils. This way, cities can be more resilient, which ensures the continuity of essential services and saves lives during disasters.
References
Caltrans (2019) After the Devastation, a Safer Highway System. In: Caltrans. https://dot.ca.gov/programs/public-affairs/mile-marker/winter-2019-2020/copy-of-loma-prieta. Accessed 22 Aug 2023
Li C, Hao H, Bi K, Li H (2014) Life-Cycle Seismic Response Analysis of RC Bridges Considering Chloride Induced Corrosion. In: Australian Earthquake Engineering Society 2014 Conference, Nov 21-23, . Australian Earthquake Engineering Society, Lorne, Victoria, p Nov 21-23
Dong Y, Qian J, Zhai C (2022) Seismic risk assessment of transportation networks. In: Ferreira T, Rodrigues H (eds) Seismic Vulnerability Assessment of Civil Engineering Structures At Multiple Scales. Woodhead Publishing, pp 321–351
Housner GW, Thiel CC (1994) Continuing challenge: the Northridge earthquake of January 17, 1994: Report to the Director, California Department of Transportation, by the Seismic Advisory Board. CA, October
Housner GW, Thiel CC (1990) Competing against Time: Report of the Governor’s Board of Inquiry on the 1989 Loma Prieta Earthquake. Earthquake Spectra 6:681–711. https://doi.org/10.1193/1.1585592
Lee B (1990) Loma Prieta Earthquake Reconnaisance Report-Supplement to Earthquake Spectra v. 6. Earthquake Engineering Research Institute 90–91
Li C, Hao H, Li H, Bi K (2016) Seismic Fragility Analysis of Reinforced Concrete Bridges with Chloride Induced Corrosion Subjected to Spatially Varying Ground Motions. https://doi.org/101142/S0219455415500108 16:. https://doi.org/10.1142/S0219455415500108
Miller M, Baker JW (2016) Coupling mode-destination accessibility with seismic risk assessment to identify at-risk communities. Reliab Eng Syst Saf 147:60–71
Moehle J, Deierlein GG (2004) A framework methodology for performance-based earthquake engineering. In: 13th world conference on earthquake engineering. WCEE Vancouver, p 12
Taylor MAP (2017) Preface. In: Taylor MAP (ed) Vulnerability Analysis for Transportation Networks. Elsevier, pp ix–xvi
Wikipedia Sydney Harbour Bridge. https://en.wikipedia.org/wiki/Sydney_Harbour_Bridge#/media/File:Sydney_Harbour_Bridge_from_the_air.JPG. Accessed 15 Aug 2023