M 3.6 Blue Mountains earthquake of 8 March 2024.
- Briefing Note 498
An earthquake of magnitude 3.6 occurred about 10 km S of Woodford at a depth of about 8.5 km at about 8:53pm on Friday March 8 (Figure 1). No injuries or major damage was reported. There were two instances of minor damage. A house had a structural collapse to its roof, and a four-level unit block had some cracking to a wall. The purpose of this briefing is to illustrate the information about Australian earthquakes and their ground motions that is available from Geoscience Australia in near real time.

The first arriving seismic waves from an earthquake are compressional (P) waves, shown by the red dots in Figure 2. In the epicentral region, the earthquake was reported as a loud bang, which suggests that the earthquake generated audible sound waves in addition to seismic waves (ground shaking). P waves can be converted to acoustical waves (sound waves) at the ground surface. The strongest shaking in earthquakes occurs in the shear (S) waves, which arrive after the P waves and are indicated by the blue dots in Figure 2.
The ground shaking level recorded at Riverview was much lower than at other locations because it was recorded on hard bedrock at the seismological observatory there, which was established in 1909; the other recording stations are mostly located on soil sites. Figure 2 shows that the shaking lasted about 30 seconds in Sydney.
As noted in Risk Frontiers (2023), the Japanese seismologist Professor Fusakichi Omori, who had been ignoring the warnings of Assistant Professor Akitsune Imamura about an impending great earthquake in Tokyo, witnessed the arrival of the seismic waves from the great 1923 Kanto (Tokyo) earthquake on the Riverview seismograph while visiting Sydney.

The earthquake was relatively weak but was widely felt, and thousands of people reported feeling it to Geoscience Australia (Figure 3, left panel). A similar map derived from Geoscience Australia data by the U.S. Geological Survey is shown on the right panel of Figure 3. Contours of peak ground acceleration (left) and peak ground velocity (right) based on recorded ground motions and on a ground motion model where recorded data are sparse are shown in Figure 4. The strongest reported intensity in Figure 3 is “V – Moderate, very light damage,” and the strongest estimated peak accelerations and velocities (Figure 4) are 5%g and 1 cm/sec respectively, where g is the acceleration of gravity (980 cm/sec/sec). The Australian building code standard AS1170.4 prescribes a peak acceleration of about 10%g for ordinary structures.
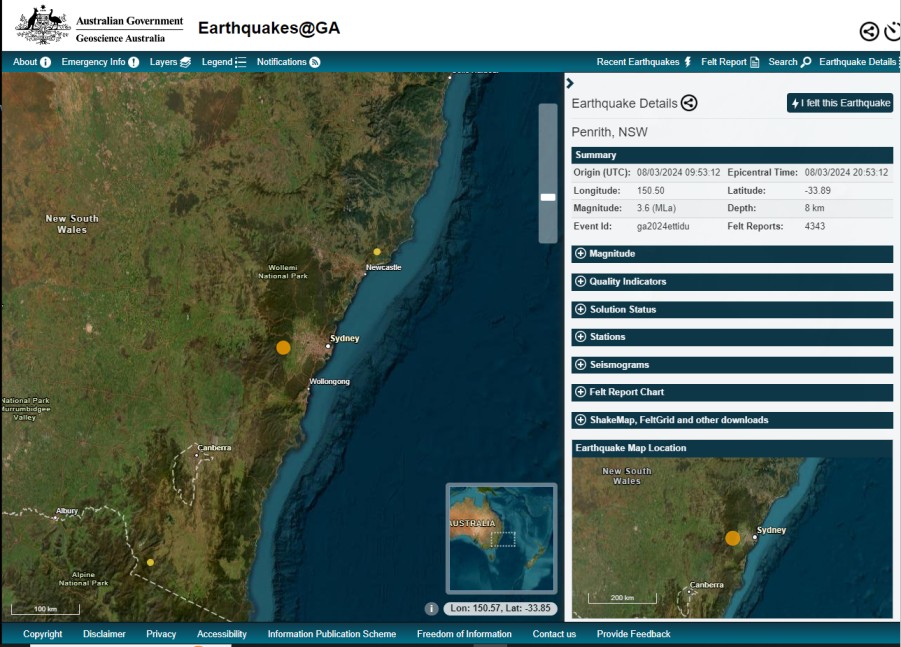
As shown in Figure 5, all of the data shown in this briefing except for the right panel of Figure 3 are accessible from the Geoscience Australia website https://earthquakes.ga.gov.au/ in near real time.


References
Geoscience Australia (2024). https://earthquakes.ga.gov.au/
Risk Frontiers (2023). The Great 1923 Kanto (Tokyo) Earthquake. Risk Frontiers Briefing Note 491.
About the author/s

Paul Somerville
Paul is Chief Geoscientist at Risk Frontiers. He has a PhD in Geophysics, and has 45 years experience as an engineering seismologist, including 15 years with Risk Frontiers. He has had first hand experience of damaging earthquakes in California, Japan, Taiwan and New Zealand. He works on the development of QuakeAUS and QuakeNZ.
