Is the forward motion of tropical cyclones in the Australian region slowing due to anthropogenic climate change?
As the Earth’s atmosphere warms, the atmospheric circulation changes. Understanding how tropical cyclone activity may change in response to this warming is no easy task, with recent studies showing considerable dispersion in projected changes in activity for the Australian region. For example, Knutson et al. (2015) projected a decrease in tropical cyclone activity, including Cat 4-5 storms, around northeast Australia. Earlier, in 2014, the IPCC Fifth Assessment Report (Reisinger et al. 2014) summarised the projected changes as “Tropical cyclones are projected to increase in intensity and stay similar or decrease in numbers and occur further south (low confidence)”.
Identifying anthropogenic climate change influences on observational records of tropical cyclone activity is also challenging. Reliable records are relatively short and contain high year-to-year variability. Most research effort has focused on identifying changes in frequency and intensity: Callaghan and Power (2010), for example, documented a long-term decline in numbers of Cat 3-5 events making landfall over eastern Australia. Other recent studies have begun to consider changes in the distribution of events and other characteristics, including their forward motion (referred to as the translation speed). Sharmila and Walsh (2018) showed that events in the Australian region may reach further south while Kossin (2018), reported on by Risk Frontiers in Briefing Note 370 in July this year, found a global slowing of translation speeds. Here we further discuss the findings of Kossin (2018) for the Australian region.
Anthropogenic warming may also cause a general weakening of summertime tropical circulation (Vecchi et al., 2006; Mann et al., 2017) and, because tropical cyclones are carried along within their ambient environmental wind, the translation speed of tropical cyclones may slow, thereby increasing the potential for flooding and longer duration sustained high wind speeds (Kossin 2018). Tropical Cyclone Debbie (Queensland, March 2017) and Hurricane Harvey (Texas, August 2017) are two recent examples of slow-moving events.
In addition to the reported global slowdown in tropical cyclone translation speeds, Kossin (2018) also analysed trends across various regions. While those for the Northern Hemisphere were strong, those for the Australian region, both over land and over water, were only marginally significant and exhibited high multi-annual variability.
Here we present an exploratory investigation of the extent to which changes in tropical cyclone translation speeds around Australia (Kossin, 2018) are driven by internal climate variability, in addition to any possible anthropogenic warming signal. The proxy for translation speeds is the ambient winds that control the movement of tropical cyclones. We begin with the tropical Indian Ocean, < 100 ° E (Fig. 1), where Kossin (2018) reported a -0.01 km/hr/yr trend between 1949 and 2016.
Chan and Gray (1981) suggested that winds between 500 and 700 mB are the most relevant measure of ambient winds that transport tropical cyclones. We extracted the 500 mB scalar wind speed monthly means (November to April – coinciding with our tropical cyclone season) from 1980/81 to 2017/18, using the NCEP-NCAR Reanalysis, for the region between 5 and 20 °S and 50 and 100 °E. (Prior to 1980, the homogeneity of the reanalysis record is questionable.)
We then compared the year-on-year scalar wind speeds (averaged within the analysis region) to the Pacific Decadal Oscillation (PDO) Index. The PDO is the leading principal component of North Pacific monthly sea surface temperature variability and can be seen as a long-lived (multi-decadal) ENSO-like pattern of Pacific climate variability. While the PDO is a Pacific-origin index, the tropical cyclone climatologies in Queensland, Northern Territory and Western Australia are principally influenced by Pacific ENSO variability, in addition to other regional climate indices such as the Indian Ocean Dipole and the Madden-Julian Oscillation.


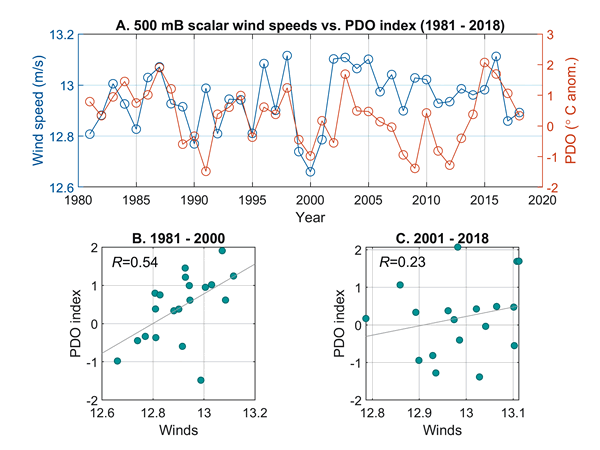
Our results show a strong correlation between the ambient environmental winds in the tropical Indian Ocean (TIO) and the PDO (average of Nov-Apr PDO values for each year)during the period 1981 – 2000 (R = 0.54, p < 0.05, Fig. 2b), but this is much diminished during the period 2001 – 2018 (R = 0.23, p < 0.05, Fig. 2c). The two time-series in Fig. 2a show a change in the relationship between the variables occurred around the year 2000. They also show that wind speeds are consistently higher post-2000.
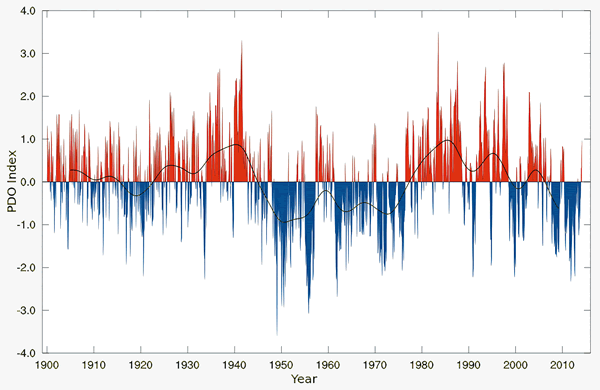
The PDO was in a sustained ‘warm’ phase (i.e. PDO positive, or El Niño–like) from approximately 1977 to 1999, after which it has experienced less coherent polarity (Fig. 3). Our analysis suggests that during this period, ambient winds (and by inference, tropical cyclone translation speeds) in the Indian Ocean were closely related to variability in the PDO. Post-2000, a weakening of the PDO signal coincides with a much-reduced level of correlation, and a jump to higher wind speeds.
It is well known that the PDO influences interdecadal variability of tropical cyclogenesis in northern Australia (Grant and Walsh, 2001). However, the importance of the PDO on cyclone translation speeds for this region remains unclear. Our brief analysis suggests PDO positive conditions suppress wind speeds in the upper atmosphere in the TIO and, by inference, reduce tropical cyclone translation speeds in this region. This is because during PDO positive (El Niño–like) conditions, sea surface temperature anomalies occur further east in the Pacific Ocean – causing the area of cyclogenesis to move eastwards away from Australia.
When the PDO signal becomes more La Niña to ENSO neutral-like (i.e. post-2000, Fig. 3), wind speeds in the TIO increase but become less correlated to the PDO Index. This suggests a more complex relationship between upper atmosphere winds in this region and other regional climate indices (like the Indian Ocean Dipole or Madden-Julien Oscillation), during multi-decadal periods where the PDO signal is not strong.
Further work is needed to fully explore these relationships, and to extend the analysis into the Pacific. What can be concluded at this juncture is that the role of internal climate variability needs also be considered when analysing tropical cyclone records.

References
Callaghan, J. & Power, S. (2010). Variability and decline in the number of severe tropical cyclones making land-fall over eastern Australia since the late nineteenth century. Clim. Dyn., 37, 647-662.
Chan, J.C. and Gray, W.M. (1981). Tropical Cyclone Movement and Surrounding Flow Relationships. Mon. Weather Rev., 110, 1354-1374.
Grant, A.P. and Walsh, K.J.E. (2001). Interdecadal variability in north-east Australian tropical cyclone formation. Atmos. Sci. Let., 1530-261X.
Kossin, J.P. (2018). A global slowdown of tropical-cyclone translation speed. Nature, 558, 104-107.
Knutson, T.R. et al. (2015). Global projections of intense tropical cyclone activity for the late twenty-first century from dynamical downscaling of CMIP5/RCP4.5 scenarios. J. Clim., 28, 7203–7224.Mann, M. E. et al. (2017). Influence of anthropogenic climate change on planetary wave resonance and extreme weather events. Sci. Rep. 7, 19831.
Reisinger, A., R.L. Kitching, F. Chiew, L. Hughes, P.C.D. Newton, S.S. Schuster, A. Tait, and P. Whetton, 2014: Australasia. In: Climate Change 2014: Impacts, Adaptation, and Vulnerability. Part B: Regional Aspects. Contribution of Working Group II to the Fifth Assessment Report of the Intergovernmental Panel on Climate Change [Barros, V.R., C.B. Field, D.J. Dokken, M.D. Mastrandrea, K.J. Mach, T.E. Bilir, M. Chatterjee, K.L. Ebi, Y.O. Estrada, R.C. Genova, B. Girma, E.S. Kissel, A.N. Levy, S. MacCracken, P.R. Mastrandrea, and L.L. White (eds.)]. Cambridge University Press, Cambridge, United Kingdom and New York, NY, USA, pp. 1371-1438.
Sharmila, S & Walsh, K.J.E. (2018). Recent poleward shift of tropical cyclone formation linked to Hadley cell expansion. Nature, 8, 730-736.
Vecchi, G. A. et al. (2006). Weakening of tropical Pacific atmospheric circulation due to anthropogenic forcing. Nature 441, 73–76.
